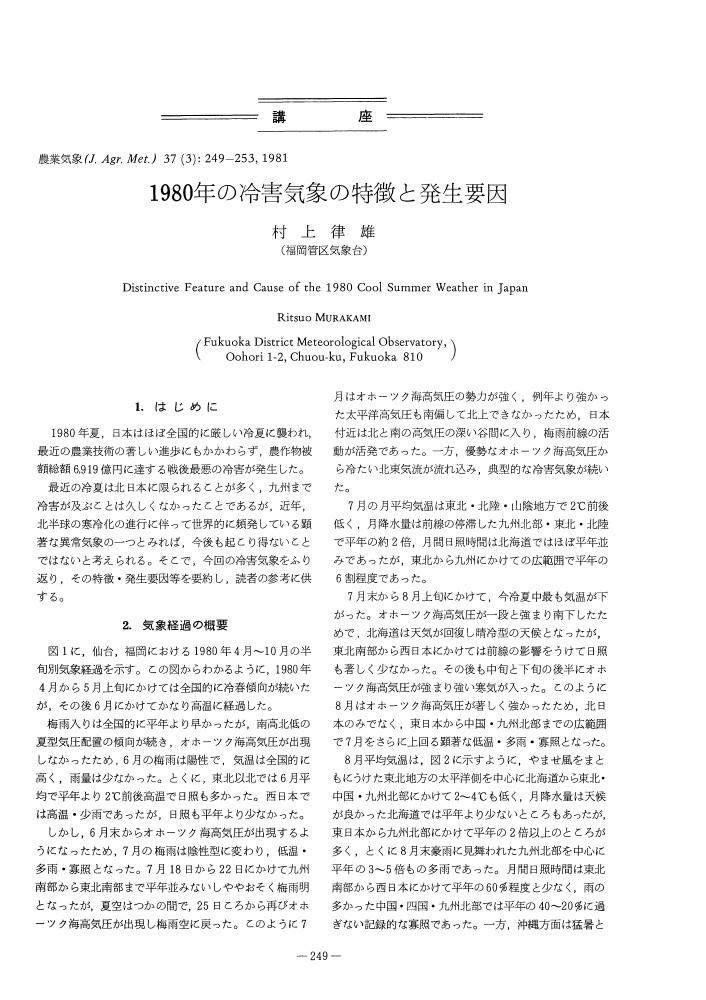
17 0 0 0 OA 1980年の冷害気象の特徴と発生要因
- 著者
- 村上 律雄
- 出版者
- The Society of Agricultural Meteorology of Japan
- 雑誌
- 農業気象 (ISSN:00218588)
- 巻号頁・発行日
- vol.37, no.3, pp.249-253, 1981-12-10 (Released:2010-02-25)
- 参考文献数
- 4
- 被引用文献数
- 1 1
8 0 0 0 OA サクラの開花史料による11世紀以降の京都の気温の推定
- 著者
- 青野 靖之 小元 敬男
- 出版者
- The Society of Agricultural Meteorology of Japan
- 雑誌
- 農業気象 (ISSN:00218588)
- 巻号頁・発行日
- vol.49, no.4, pp.263-272, 1994-03-10 (Released:2010-02-25)
- 参考文献数
- 29
- 被引用文献数
- 11 18
The change of the monthly mean temperature for March since the 11th century is estimated from the records of cherry blossom in old documents. The dates given as cherry blossom festivals in old diaries and chronicles are assumed as full flowering dates of Prunus jamasakura, one of the native cherry tree species of Japan. The temperatures are estimated by means of DTS method, which has been used to estimate flowering date from temperature data. It is shown that computations for the recent 40 years proved that the decadal average values of the March temperature may be obtained by the method for P. jamasakura with the accuracy of 0.1°C of the root mean square error.It is shown that the entire study period can be roughly divided into three subsections. In the first period (the 11-13th centuries), the March appeared to be generally very warm compared with other periods, however, accuracy of the estimated values are rather poor because decadal averages are computed from relatively small number of years due to missing of records.For the second period (the 14-16th centuries), there was a period of warming of 2°C from 1470's to 1610's, otherwise the decadal averages suggest large fluctuations, at least partly attributed to poor quality of full flowering data of P. jamasakura.For the third period (the 17-20th centuries), temperatures generally tend to be estimated in low values, especially estimations in 1690-1710's and 1810-30's continued to the present is noticeable. The rise amounts to 3.4°C seems due both to urban warming and larger scale warming over the central Japan roughly the same degree.
5 0 0 0 OA 実況値と数値予報,平年値を組み合わせたメッシュ気温・降水量データの作成
- 著者
- 大野 宏之 佐々木 華織 大原 源二 中園 江
- 出版者
- The Society of Agricultural Meteorology of Japan
- 雑誌
- 生物と気象 (ISSN:13465368)
- 巻号頁・発行日
- vol.16, pp.71-79, 2016 (Released:2016-03-01)
- 参考文献数
- 13
- 被引用文献数
- 12 130
We developed a method for determining nationwide 1 km-grid square values of daily mean, maximum and minimum air temperature, and daily precipitation in Japan. The data were obtained using the JMA's nationwide observations, numerical forecasts, and climatic normal values. RMSE values for these elements in the past were 0.66 °C, 0.98 °C, 1.10 °C, and 5.9 mm/day, while those for one-day future were 1.18 °C, 1.65 °C, 2.00 °C, and 11.0 mm/day, respectively. The improvement in accuracy by introducing the forecasts was recognized even for values six-day future, though errors tended to increase with forecast range. The data are intended for use in the management of currently growing crops with a combination of crop models.
4 0 0 0 OA 自発休眠期の気温を考慮したソメイヨシノの開花日の簡便な推定法
- 著者
- 青野 靖之 村上 なつき
- 出版者
- The Society of Agricultural Meteorology of Japan
- 雑誌
- 生物と気象 (ISSN:13465368)
- 巻号頁・発行日
- vol.17, pp.25-33, 2017 (Released:2017-04-10)
- 参考文献数
- 32
- 被引用文献数
- 6 8
We constructed a simplified method to estimate first flowering dates of cherry tree (Prunus×yedoensis), considering temperature conditions in endodormancy process. We adopted the DTS method, which is an accumulation model of forcing effect of temperatures during developing process, as an estimation model of cherry blossom phenology in this study. In our previous studies, DTS method with fixed (pre-determined) starting dates for each site showed high accuracies for cold regions, whereas low accuracies for warm regions. Such accuracy drop was attributed to the volatility in endodormancy completion in warmer region of Japan, affected by inter-annual variation in chilling temperature during winter season. In order to reduce such error, it had been necessary to calculate chilling hours from hourly temperature data and evaluate the progress in endodormancy releasing process, with complicated conventional procedures. In our new model, an annual discrepancy in starting date of forcing effect from the pre-determined dates, calculated from a simplified procedure in our previous model, were calculated as the product of the correction coefficient, Ci, for each year and a winter temperature normal value above a threshold of chilling effect for endodormancy release, (TDJ-1.5), for each site. Annual correlation coefficient Ci was calculated from averaged winter temperatures at 7 secular observatories in warm region in Japan. Estimated first flowering dates with and without correction of starting dates were compared each other. The estimations by new method kept under about 3.2 days of RMSE. The introduction of new method also reduced RMSE within 3 days into approximately half of stations, applied to verification of new method with relatively long (50-year) period.
4 0 0 0 OA 1991年台風17・19号による九州の農業災害
- 著者
- 山本 晴彦
- 出版者
- The Society of Agricultural Meteorology of Japan
- 雑誌
- 農業気象 (ISSN:00218588)
- 巻号頁・発行日
- vol.48, no.1, pp.77-83, 1992-06-10 (Released:2010-02-25)
- 参考文献数
- 14
- 被引用文献数
- 2 1
4 0 0 0 OA 1989年の日本の天候の特徴
- 著者
- 菊地 正武
- 出版者
- The Society of Agricultural Meteorology of Japan
- 雑誌
- 農業気象 (ISSN:00218588)
- 巻号頁・発行日
- vol.46, no.1, pp.23-29, 1990-06-10 (Released:2010-02-25)
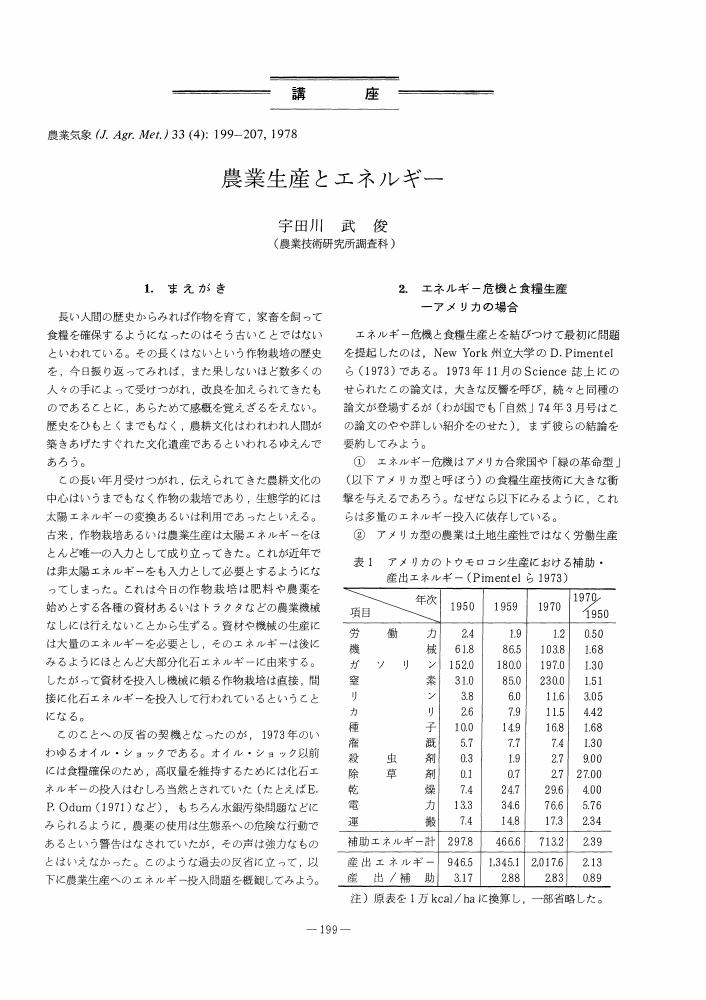
4 0 0 0 OA 農業生産とエネルギー
- 著者
- 宇田川 武俊
- 出版者
- The Society of Agricultural Meteorology of Japan
- 雑誌
- 農業気象 (ISSN:00218588)
- 巻号頁・発行日
- vol.33, no.4, pp.199-207, 1978-03-15 (Released:2010-02-25)
- 参考文献数
- 11
- 被引用文献数
- 1
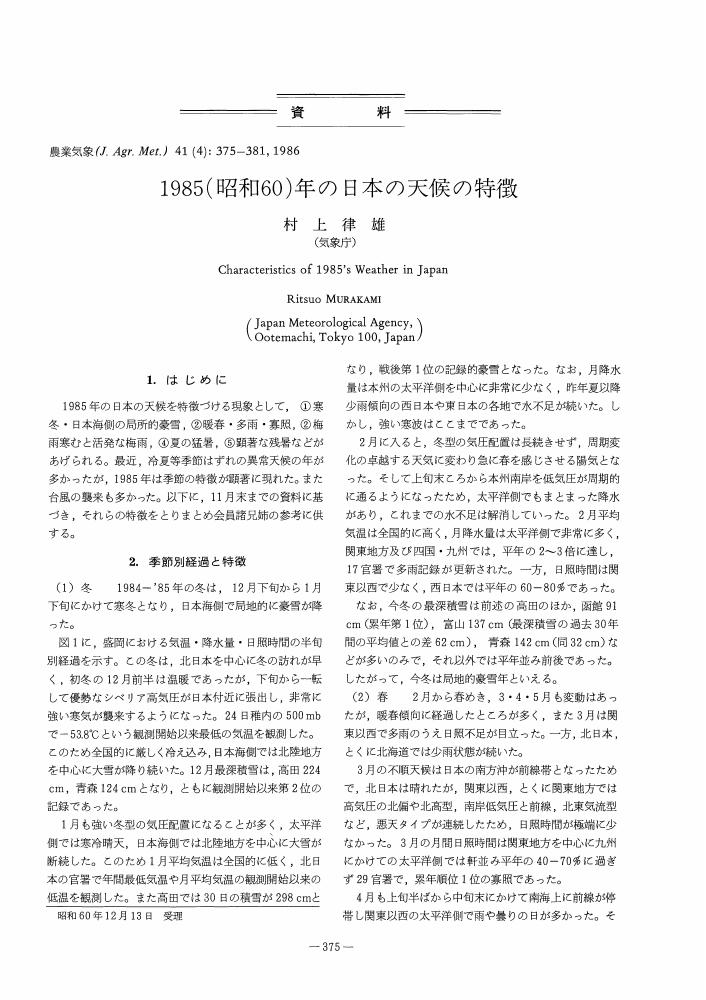
3 0 0 0 OA 1985 (昭和60) 年の日本の天候の特徴
- 著者
- 村上 律雄
- 出版者
- The Society of Agricultural Meteorology of Japan
- 雑誌
- 農業気象 (ISSN:00218588)
- 巻号頁・発行日
- vol.41, no.4, pp.375-381, 1986-03-10 (Released:2010-02-25)
- 参考文献数
- 10
3 0 0 0 OA 1993 (平成5) 年夏の日本の異常天候
- 著者
- 北村 修
- 出版者
- The Society of Agricultural Meteorology of Japan
- 雑誌
- 農業気象 (ISSN:00218588)
- 巻号頁・発行日
- vol.49, no.3, pp.183-188, 1993-12-10 (Released:2010-02-25)
- 著者
- Akihiko ITO Kazuhito ICHII
- 出版者
- The Society of Agricultural Meteorology of Japan
- 雑誌
- 農業気象 (ISSN:00218588)
- 巻号頁・発行日
- pp.D-20-00024, (Released:2020-12-25)
- 参考文献数
- 178
- 被引用文献数
- 3
A wide variety of models have been developed and used in studies of land-atmosphere interactions and the carbon cycle, with aims of data integration, sensitivity analysis, interpolation, and extrapolation. This review summarizes the achievements of model studies conducted in Asia, a focal region in the changing Earth system, especially collaborative works with the regional flux measurement network, AsiaFlux. Process-based biogeochemical models have been developed to simulate the carbon cycle, and their accuracy has been verified by comparing with carbon dioxide flux data. The development and use of data-driven (statistical and machine learning) models has further enhanced the utilization of field survey and satellite remote sensing data. Model intercomparison studies were also conducted by using the AsiaFlux dataset for uncertainty analyses and benchmarking. Other types of models, such as cropland models and trace gas emission models, are also briefly reviewed here. Finally, we discuss the present status and remaining issues in data-model integration, regional synthesis, and future projection with the models.
3 0 0 0 佐賀県の台風と雨
- 著者
- 佐賀測候所
- 出版者
- The Society of Agricultural Meteorology of Japan
- 雑誌
- 農業気象 (ISSN:00218588)
- 巻号頁・発行日
- vol.12, no.4, pp.157-158, 1957
The relation between the rainfall of various districts and the typhoon is settled by the position and the track of typhoon.<br>The rainfall of various districts as a rule when the typhoon exists southwards from the line of the 28th degree of the north latitude.<br>The rainfall of Mitsuse is nearly doubles of Saga as Fig. 1 when the typhoon passes the west or north side of Saga.<br>The rainfall of Mitsuse is about eleven fold of Saga as Fig. 2 when the typhhoon lands in the southern end of Kyushu and then progresses to north-north-eastwards or the typhoon passes the east of Miyazaki and then progresses to northwards.<br>But the rainfall of Mitsuse is only thrice when the typhoon lands in the southern end of Kyushu and then progresses to northwards.
- 著者
- Tsuyoshi HONJO Tzu-Ping LIN Yuhwan SEO
- 出版者
- The Society of Agricultural Meteorology of Japan
- 雑誌
- 農業気象 (ISSN:00218588)
- 巻号頁・発行日
- vol.75, no.2, pp.59-66, 2019 (Released:2019-04-10)
- 参考文献数
- 27
- 被引用文献数
- 18 22
Sky view factor (SVF) is a ratio of sky in upper hemisphere and is an important index for many environmental studies. Frequently used method for measuring SVF is taking fisheye image of upper hemisphere by a camera with fisheye lens (Nikon FC-E8 and FC-E9). In this study, we devised the usage of a spherical camera (RICOH Theta S), which can takes a picture with 360° field of view (FOV), for SVF measurement. Applicability of the spherical camera to the measurement of SVF is tested by comparing with conventional fisheye cameras. The result showed that it can take the same quality of fisheye images as conventional fisheye camera and can be applied to the measurement of SVF. Accuracy and causes of errors are considered and as a conclusion, the spherical camera has enough performance for the replacement of conventional cameras. The algorithm of making fisheye images of different projection methods and of calculating SVF are written as programs in R.
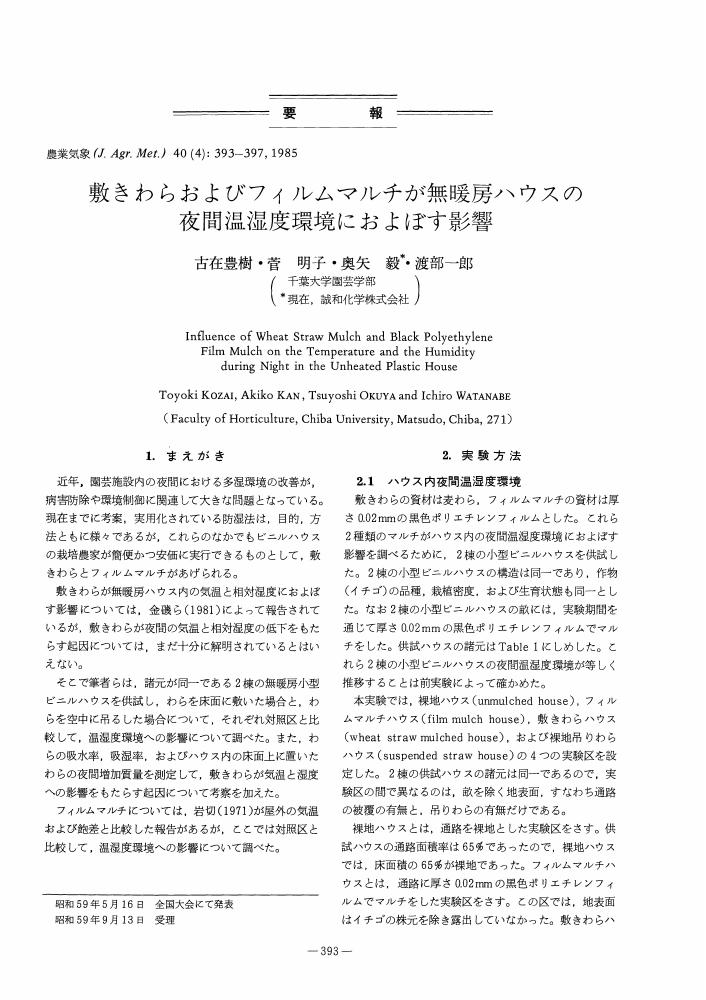
2 0 0 0 OA 敷きわらおよびフィルムマルチが無暖房ハウスの夜間温湿度環境におよぼす影響
- 著者
- 古在 豊樹 菅 明子 奥矢 毅 渡部 一郎
- 出版者
- The Society of Agricultural Meteorology of Japan
- 雑誌
- 農業気象 (ISSN:00218588)
- 巻号頁・発行日
- vol.40, no.4, pp.393-397, 1985-03-10 (Released:2010-02-25)
- 参考文献数
- 8
- 被引用文献数
- 2
- 著者
- Yoshiyuki KINOSE Yuji MASUTOMI Fumitaka SHIOTSU Keiichi HAYASHI Daikichi OGAWADA Martin GOMEZ-GARCIA Akiko MATSUMURA Kiyoshi TAKAHASHI Kensuke FUKUSHI
- 出版者
- The Society of Agricultural Meteorology of Japan
- 雑誌
- 農業気象 (ISSN:00218588)
- 巻号頁・発行日
- pp.D-19-00045, (Released:2019-12-19)
- 参考文献数
- 48
- 被引用文献数
- 7 14
In Asia, where rice is a major crop, there is high concern about the detrimental effects of climate change on rice productivity. Evaluating these effects, considering the country-specific cultivars’ responses to climate, is needed to effectively implement the national adaptation plans to maintain food security under climate change. However, to date, information on the effects of climate change on the local rice cultivars used in developing countries is extremely limited. In the present study, we used a process-based crop growth model, MATCRO-Rice, to predict the impact of climate change on yields of the major local rice cultivar Ciherang in Indonesia during the next 25 years (2018-2042). This model simulated the effects of current to future air temperature, precipitation, and atmospheric carbon dioxide concentration on rice yield. A total of 14 future climate scenarios, derived from a combination of four general circulation models and three or four representative concentration pathway scenarios in the Coupled Model Intercomparison Project Phase 5, were used to consider the uncertainty of the future climate. The results showed that the rice yield was reduced under all climate scenarios, mainly because of the higher air temperature, leading to reduced photosynthetic rates, increased respiration rates, and phenological changes such as acceleration of senescence. The mean yield reduction across the 14 future climate scenarios was 12.1% for all of Indonesia in 2039-2042. Therefore, to maintain yields in Indonesia, rice production needs to adapt to climate change, and especially to higher air temperatures, in the near future.
- 著者
- Kazuhiro FUJIWARA Shunsuke KUBO Kensuke EIJIMA Ryo MATSUDA Akira YANO
- 出版者
- The Society of Agricultural Meteorology of Japan
- 雑誌
- 農業気象 (ISSN:00218588)
- 巻号頁・発行日
- vol.78, no.3, pp.101-112, 2022-07-10 (Released:2022-07-10)
- 参考文献数
- 26
We have improved a light-emitting diode artificial sunlight source system that we developed in 2013. The 2013 system can produce light with various spectral distributions for wavelengths of 380-940 nm that approximates those of ground-level sunlight and produce light with arbitrarily modified spectral distributions. Moreover, this system can produce time-varying light with different spectral distributions. However, this system’s utility is limited because the light it produces has low maximum irradiance and low time-stability for sunlight-effect research experiments. Hardware and software improvements to that system allow it to now produce a maximum irradiance of approximately 1.54 kW m-2 for 380-940 nm at a 7.1 cm2 light outlet with greater time stability and make it easier to produce time-varying light having a large number of different spectral distributions. First-step operational tests showed that this improved system can accurately produce single light with spectral irradiance distributions (SIDs) approximating: (1) SIDs of ground-level sunlight measured in Tokyo at two-hour intervals on a clear day; (2) various magnifications (1.33, 1.2, 1, 1/10, 1/100, and 1/1000 times) of a reference terrestrial solar SID, which is defined by the International Electrotechnical Commission; and (3) various geometric-shape SIDs as arbitrarily modified ones, except for a rectangular shape. For the second-step operational test, time-varying light with the three SIDs described above was produced in various sequences at three-second intervals. The third-step operational test verified the 30-min time stability of SID at the light outlet. Operational tests indicate that the improved system can facilitate various sunlight-effect research. Our improved system enables sunlight-effect research experiments that were previously impossible, such as investigations of naturally fluctuating sunlight effects on plant response, growth, and development. Moreover, experiments comparing the effects of ground-level sunlight spectral distribution and conventional artificial lamps on plant growth and development are now possible.
2 0 0 0 OA 1992 (平成4) 年の日本の天候の特徴
- 著者
- 北村 修
- 出版者
- The Society of Agricultural Meteorology of Japan
- 雑誌
- 農業気象 (ISSN:00218588)
- 巻号頁・発行日
- vol.49, no.1, pp.41-47, 1993-06-10 (Released:2010-02-25)
- 著者
- Akihiko ITO
- 出版者
- The Society of Agricultural Meteorology of Japan
- 雑誌
- 農業気象 (ISSN:00218588)
- 巻号頁・発行日
- vol.77, no.4, pp.211-223, 2021 (Released:2021-10-10)
- 参考文献数
- 104
The increasing amount of measurement data on land-atmosphere flux has made it possible to assess the interannual and longer processes that are driven by environmental change and disturbance of terrestrial ecosystems. In this study, I used a global dataset of carbon dioxide (CO2) fluxes at eddy-covariance tower sites (FLUXNET2015) to investigate long-term trends of net ecosystem CO2 exchange (NEE), gross primary production (GPP), ecosystem respiration (RE), and related variables. From 118 sites with records of at least 5-years duration, I extracted 1198 site-years of data for use in my analyses. Applying moderate screening by data quality, I found that 58% of the sites showed increasing trends as net CO2 sinks, in which median slopes of annual NEE of -1.4 and -4.1 g C m-2 y-2 were obtained by linear regression and Sen’s slope estimator. Both GPP and RE showed increasing trends at different slopes; their slopes were positively correlated among sites. Across-site variation of NEE trends was analyzed by generalized linear mixed modeling; the best statistical model used temperature, stand age, and biome type as explanatory variables. The trend of increasing CO2 sinks differed among biome types, from almost none in grassland and savanna to steep slopes in deciduous broad-leaved forest sites. The flux trends derived from terrestrial model simulations showed that the increasing sink trend also prevails over the land. The global model simulations implied that the increasing land sink is primarily attributable to elevated CO2 concentration. These results demonstrate the usefulness of flux measurement datasets, especially in conjunction with models, to deepen our understanding of long-term terrestrial ecosystem processes.
2 0 0 0 OA 関東甲信地方の降ひょうについて(1)
- 著者
- 小元 敬男
- 出版者
- The Society of Agricultural Meteorology of Japan
- 雑誌
- 農業気象 (ISSN:00218588)
- 巻号頁・発行日
- vol.24, no.1, pp.33-38, 1968-06-20 (Released:2010-02-25)
- 参考文献数
- 11
- 被引用文献数
- 2 2
This paper gives climatological information on hail occurrence in Kanto-Koshin District. Hailstorms occur mostly in the warm season in this area, therefore, climatology of warm season hailstorms is studied in detail.Data of the recent eitght years are used to obtain a frequency distribution, for it is possible to determine hail patterns for most of hailstorms occurred during this period. As shown in Fig. 4, there are three distinct maxima and two secondary maxima in the frequency distribution. It is noteworthy that all of these maxima are situated about 70km east through southeast of major mountain areas.Locations of hailswaths observed during the eight year-period are examined. The result (Fig. 5a-5d) indicates that the local farmer's tradition “hailstorms always take the similar routes” is not entirely untrue. A number of interseting features may be pointed out from the result, some of them are as follows:1) Most hailstorms in this region move east through southeastward. However, in the western region most hailstorms are eastward moving, whereas eastern region there are more southeastward moving storms.2) Hailstorms moving east-southeastward are associated with thunderstorms developed near the NW-Gunma Mtns or the Nikko Mtns, whereas those moving northeastward are associated with thunderstorms developed near the Chichibu Mtns.3) Hailstorms move from mountain areas toward lower lands, they rarely cross big mountain regions, and sometimes change courses to follow valleys.Finally, long term variations of hail occurrence are studied. Although long term increase of hail days seems to exist (Fig. 6), at least partly, it is attributed to the tendency that fewer records remain for earlier days. However, the records for recent 20 years indicate increase in hailstorm activities druing the last several years. Computations of correlation coefficients between different areas and stations are made. The result suggested that for long term view point, hail occurrence is quite random.
2 0 0 0 OA 冷害と宮沢賢治
- 著者
- 卜蔵 建治
- 出版者
- The Society of Agricultural Meteorology of Japan
- 雑誌
- 農業気象 (ISSN:00218588)
- 巻号頁・発行日
- vol.47, no.1, pp.35-41, 1991-06-10 (Released:2010-02-25)
2 0 0 0 OA Photo-CDの利用法
- 著者
- 後藤 英司
- 出版者
- The Society of Agricultural Meteorology of Japan
- 雑誌
- 農業気象 (ISSN:00218588)
- 巻号頁・発行日
- vol.50, no.1, pp.55-58, 1994-06-10 (Released:2010-02-25)
