1 0 0 0 OA 土壌水分量の測定法
- 著者
- 白井 清恒
- 出版者
- The Society of Agricultural Meteorology of Japan
- 雑誌
- 農業気象 (ISSN:00218588)
- 巻号頁・発行日
- vol.37, no.4, pp.333-335, 1982-03-10 (Released:2010-02-25)
- 参考文献数
- 4
- 著者
- Yoshiyuki KINOSE Yuji MASUTOMI Fumitaka SHIOTSU Keiichi HAYASHI Daikichi OGAWADA Martin GOMEZ-GARCIA Akiko MATSUMURA Kiyoshi TAKAHASHI Kensuke FUKUSHI
- 出版者
- The Society of Agricultural Meteorology of Japan
- 雑誌
- 農業気象 (ISSN:00218588)
- 巻号頁・発行日
- vol.76, no.1, pp.19-28, 2020 (Released:2020-01-10)
- 参考文献数
- 48
- 被引用文献数
- 14
In Asia, where rice is a major crop, there is high concern about the detrimental effects of climate change on rice productivity. Evaluating these effects, considering the country-specific cultivars’ responses to climate, is needed to effectively implement the national adaptation plans to maintain food security under climate change. However, to date, information on the effects of climate change on the local rice cultivars used in developing countries is extremely limited. In the present study, we used a process-based crop growth model, MATCRO-Rice, to predict the impact of climate change on yields of the major local rice cultivar Ciherang in Indonesia during the next 25 years (2018-2042). This model simulated the effects of current to future air temperature, precipitation, and atmospheric carbon dioxide concentration on rice yield. A total of 14 future climate scenarios, derived from a combination of four general circulation models and three or four representative concentration pathway scenarios in the Coupled Model Intercomparison Project Phase 5, were used to consider the uncertainty of the future climate. The results showed that the rice yield was reduced under all climate scenarios, mainly because of the higher air temperature, leading to reduced photosynthetic rates, increased respiration rates, and phenological changes such as acceleration of senescence. The mean yield reduction across the 14 future climate scenarios was 12.1% for all of Indonesia in 2039-2042. Therefore, to maintain yields in Indonesia, rice production needs to adapt to climate change, and especially to higher air temperatures, in the near future.
1 0 0 0 OA 気温測定の精度について (1)
- 著者
- 荒井 哲男
- 出版者
- The Society of Agricultural Meteorology of Japan
- 雑誌
- 農業気象 (ISSN:00218588)
- 巻号頁・発行日
- vol.22, no.3, pp.109-112, 1967-01-30 (Released:2010-02-25)
- 参考文献数
- 4
- 被引用文献数
- 1
Two main errors arise from radiation and thermal inertia in the measurement of the air temperature and they interact with each other.It is too complicated to deal with the radiation errors theoretically, then the author introduces some special conceptions to study this subject.A thermometer receives heat radiation from the sun, cloud, obstacles and atmospheric water vapor etc. We supposed that those radiation fluxes come from the hypothetically black body which envelopes theromometer. Now being θ* the temperature of this body, φ denotes the ratio of the convective conduction to radiative heat exchange of the therometer, and θ0 is real air temperature thermodynamically defined.The variation of indication of the thermomter with time may be written;dθ/dt=-C{φ(θ-θ0)+(θ-θ*)}.Hence, in equilibrium, the reading of the thermometer is as follows:Θ=φθ0+θ*/φ+1.Then, if α is the time constant of the thermometer;1/α=C(φ+1).The value of φ was determined by this relationship, after measuring the lag of a thrmometer (Fig. 2). Thus, the error of thermomtry may be expressed byδ=Θ-θ0=θ*-Θ/φ.If we keep the accuracy of the thermometry by 0.1°C, the necessary condition is as follows|δ|=|θ*-θ0|/φ<0.05°CThe application of those formulas to the practical thermometry will be described in a next paper.
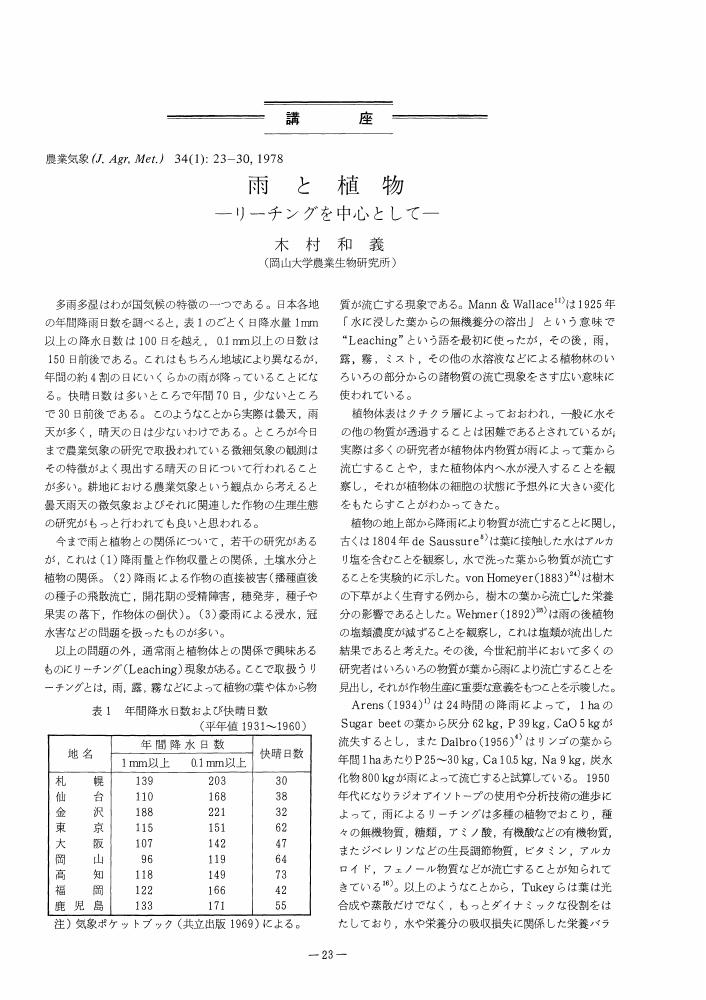
1 0 0 0 OA 雨と植物
- 著者
- 木村 和義
- 出版者
- The Society of Agricultural Meteorology of Japan
- 雑誌
- 農業気象 (ISSN:00218588)
- 巻号頁・発行日
- vol.34, no.1, pp.23-30, 1978-06-15 (Released:2010-02-25)
- 参考文献数
- 25
- 被引用文献数
- 2
1 0 0 0 OA 果樹や林木における風倒被害対策について
- 著者
- 山本 良三
- 出版者
- The Society of Agricultural Meteorology of Japan
- 雑誌
- 農業気象 (ISSN:00218588)
- 巻号頁・発行日
- vol.35, no.3, pp.177-187, 1979-12-25 (Released:2010-02-25)
- 参考文献数
- 3
- 被引用文献数
- 3 6
1 0 0 0 OA 1994(平成6)年の日本の天候の特徴
- 著者
- 北村 修
- 出版者
- The Society of Agricultural Meteorology of Japan
- 雑誌
- 農業気象 (ISSN:00218588)
- 巻号頁・発行日
- vol.51, no.2, pp.159-165, 1995-06-10 (Released:2010-02-25)
1 0 0 0 OA 散水による局所的地表面温度の低下が気温に与える影響
- 著者
- 今 久 洪 聖善 松岡 延浩
- 出版者
- The Society of Agricultural Meteorology of Japan
- 雑誌
- 農業気象 (ISSN:00218588)
- 巻号頁・発行日
- vol.52, no.3, pp.241-245, 1996-09-10 (Released:2010-02-25)
- 参考文献数
- 4
An experiment was conducted to see how much the air temperature on the ground was cooled by the cooling of soil surface due to local watering. The day was fine and the soil was very dry, so the temperature of soil surface amounted to more than 50°C. But it was cooled by 20°C due to watering. The cooling of soil surface cooled the air on the ground. In the case of watering from 5cm radius to 5m radius, the cooling effect of soil surface attained to higher air layer according to the increase of watering radius. The height influenced: z (cm) was represented by the power function with the watering radius: r (cm). The relation is represented as the following function, z=(r/6.39)1.03The air on the ground was cooled by 6°C at the 1cm height and by 3°C at 10cm height by the watering of 5m radius. The cooling degree of the air temperature at each height was represented by the logarithmic function of the height.
1 0 0 0 湖周辺の局地気候:第2報 洞爺湖周辺, 春および夏の気温分布
- 著者
- 高橋 英紀 板垣 昭彦
- 出版者
- The Society of Agricultural Meteorology of Japan
- 雑誌
- 農業気象 (ISSN:00218588)
- 巻号頁・発行日
- vol.36, no.1, pp.13-18, 1980
- 被引用文献数
- 4
湖沼が周辺地域の自然や農業に及ぼす影響を知る手がかりとして, 湖沼周辺の局地気候に関する研究を開始し, 第1報では洞爺湖周辺の冬期の気温分布について報告したが, 今回は春から夏にかけての同地域の気候調査を行なった。1977年6月の観測は冬の観測と同様, 銅・コンスタンタン熱電対温度計のセンサーを自動車の屋根にとりつけ, 気温を記録しながら湖岸にそって周回し, 気温分布をしらべた。1978年4月~5月の観測では湖の北西岸の地域に6ケ所の観測点を設けて最高・最低気温を測定し, そのうち4観測点では気温を自記させた。得られた結果を要約すると次のごとくとなる。<br>(1) 湖周辺全体の気温分布は, 日中, 気温が水温より高いときには湖の風下で明瞭な低温域が見られ, 風上地域と約4℃の差があった。<br>(2) 湖の風下地域では湖岸から内陸に入るにともない気温は上昇したが, 約1.5kmまで湖の影響が見られた。<br>(3) 湖岸と内陸との気温差は風向により大きく異なり, 湖から吹く時は, 日中で約6℃の差が観測された。
1 0 0 0 OA 積雪計測法
- 著者
- 村松 謙生
- 出版者
- The Society of Agricultural Meteorology of Japan
- 雑誌
- 農業気象 (ISSN:00218588)
- 巻号頁・発行日
- vol.38, no.4, pp.423-424, 1983-03-10 (Released:2010-02-25)
- 参考文献数
- 6
- 著者
- 北村 一男
- 出版者
- The Society of Agricultural Meteorology of Japan
- 雑誌
- 農業気象 (ISSN:00218588)
- 巻号頁・発行日
- vol.25, no.3, pp.151-156, 1969
(1) プラスチックハウスを, 通風管を通る温風で暖房する場合のハウス内気温を時間・ハウス内の位置の関数として熱収支法で解板した。<br>(2) 解析から, ハウス内気温の場所による温度差は時間の経過に影響を受けないことがわかる。<br>(3) 埼玉園試のハウスについて理論式から計算した値と, 実際に観測した値を比較した場合, 両方の値はかなり接近していた。<br>(4) 送風機の風量が小さいと暖房機に近い所が高温になり, 逆に送風機の風量が大きいと通風管の放出端の近くが高温になる。埼玉園試の面積408平方米のファイロンハウスでは風量が中間の場合にハウス内温度差が小さくなると計算された。風量が大きい程ハウス内の温度差が小さくならなかつた。<br>(5) カーテンの熱伝達率が小さい場合について計算してみると, 暖房機の発熱量・送風量が共に小さくとも, ハウス内気温は高温になりしかも温度差も小さくなつた。
- 著者
- Kai Keiko Kainuma Mikiko Murakoshi Naomi Omasa Kenji
- 出版者
- The Society of Agricultural Meteorology of Japan
- 雑誌
- 農業気象 (ISSN:00218588)
- 巻号頁・発行日
- vol.48, no.5, pp.771-774, 1993
- 被引用文献数
- 8
Strong correlations were found between blooming dates and meteorological factors. Based on these correlations, predictive maps of blooming dates in the Japanese Islands were proposed for each case of 1, 2 and 3°C of warming. The correlation was tested for the blooming dates of <i>Prunus yedoensis, Prunus mume, Camellia japonica, Taraxacum, Rhododendron kaempferi, Wistaria floribunda, Lespedeza bicolor, Hydrangea macrophylla, Lagerstroemia indica, Miscanthus sinensis</i>, etc., using the data of monthly mean temperatures, warming indices and cold indices from 102 meteorological stations in Japan between 1953-1990. Simple and multiple regression analyses were used for the correlation.<br>Among meteorological factors, the strongest correlation was shown for monthly mean temperatures. Notably, the strongest was obtained for the case of <i>Prunus yedoensis</i>. The cold index and mean temperature of the previous December also showed the best correlation for species such as <i>Prunus mume</i> and <i>Camellia japonica</i>. Strong correlations between the leaf color-changing dates of Ginkgo biloba and Acer palmatum and the monthly mean temperature were found in one month of autumn. In these species, there was a delay of 2-7 days with a 1 degree increase in mean temperature.<br>The 30-year 1km<sup>2</sup> temperature-climate mesh-file developed by the Japan Meteorological Agency was used for the phenological estimation and predictive maps of blooming dates. Each observatory station was classified according to its annual mean temperature. Blooming for each mesh was estimated through monthly mean temperatures and regression equations of corresponding stations. Then, distribution maps of predictive blooming dates distinguished by 5-day divisions were made.
1 0 0 0 本邦に於ける氣温年變化に見られる諸特性
- 著者
- 福井 英一郎
- 出版者
- The Society of Agricultural Meteorology of Japan
- 雑誌
- 農業気象 (ISSN:00218588)
- 巻号頁・発行日
- vol.1, no.2, pp.145-152, 1944
(1) 半旬期別平均値で調べると最寒期は日本の大部分の地方で第5期 (1月21日~25日) が之に相當し, 一部の地方 (裏日本西半部, 琉球, 臺灣) では稍々晩れて現はれるが之は此の前後に於ける雲量及降水量の最多期と一致する。最も高温なのは第45期 (8月9日~13日) に現はれる場合が最多く, 臺灣, 琉珠, 南九州, 甲信地方では之より早いが之も此前後を通じて雲量と降水量が最も少くなる時に當つてゐる。<br>(2) 寒の戻りは日本では第27半旬 (5月11日~15昭) に出現し, 此の場合は殆ど其時期が一致して場所によつての遲速が認められない。其原因として考へられるのは前線帯の通過で此時期に通過するものが最定時性を有つてゐる爲と考へられる。秋の殘暑は第58半旬 (10月13日~17日) に出現することが最も多いが氣温の上昇量は前の場合の低下量に比して可なり小さい。<br>(3) 氣温の昇降度を6半旬頃に區切つて求めて見ると春及秋に最大きな値を示す。之は前線や低氣壓の通過に基くものと考へられる。又其地理的分布は緯度及水陸配布の影響が最大きい。
- 著者
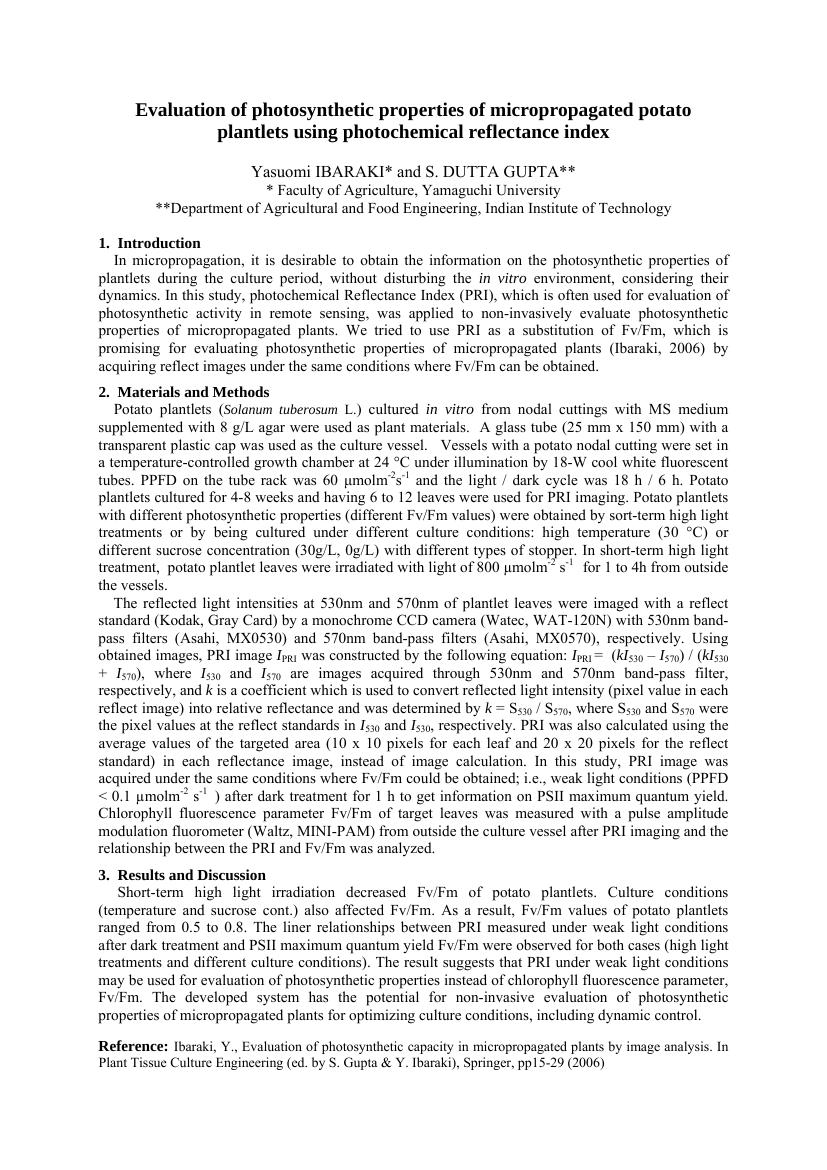
- Yasuomi Ibaraki S. Dutta Gupta
- 出版者
- The Society of Agricultural Meteorology of Japan
- 雑誌
- 日本農業気象学会大会講演要旨
- 巻号頁・発行日
- pp.72, 2009 (Released:2010-03-15)
1 0 0 0 OA Lシステムを用いたヒマワリの形状モデリング
- 著者
- 武田 知己 平野 高司 浦野 慎一 堀口 郁夫
- 出版者
- The Society of Agricultural Meteorology of Japan
- 雑誌
- 農業気象 (ISSN:00218588)
- 巻号頁・発行日
- vol.57, no.3, pp.145-153, 2001-09-10 (Released:2010-02-25)
- 参考文献数
- 14
- 被引用文献数
- 1 1
Canopy structure of crops is an important factor determining the radiation environment of the canopy. Although many researchers have dealt with foliage distribution by using a probability density function, studies that reproduce a spatial destribution and spatial form of foliage in 3 dimensional (3D) space have only recently been reported. In this study, we developed a geometric model by using L-system to reproduce the form of sunflower plants in 3D space. The model consisits of frame and leaf models. In order to obtain functions to illustrate the frame model, positions of nodes, leaf bases, and leaf tips were measured from photographs of sunflower plants taken at five different stages in a growing season, and lengths of internode, petiole and leaf were determined. Moreover, lengths of five lateral veins, and divergence angle between midrib and fifth lateral vein were measured.Growth curve of internode and petiole could be expressed as a logistic function of step number in L-system. Leaves elongated as a function of petiole length. Zenith angle of petiole decreased with step number from 1 to 7, and then stabilized at about 35°. Leaf zenith angle was related to petiole zenith angle. Divergence angles between successive leaves differed in different phyllotaxis. In distichous phyllotaxis, divergence angle was 180° between the leaves at the same node, and 90° between the leaves at successive nodes. On the other hand, in alternate phyllotaxis, divergence angle was about 135°. Leaf expansion could be related to increase in leaf length.In conclusion, the geometric model using L-system successfully reproduced the growth of sunflower plants with increase in node number.


