2 0 0 0 OA 史料に記録された中世における東日本太平洋沿岸の津波
- 著者
- 行谷 佑一 矢田 俊文
- 出版者
- 公益社団法人 日本地震学会
- 雑誌
- 地震 第2輯 (ISSN:00371114)
- 巻号頁・発行日
- vol.66, no.4, pp.73-81, 2014-03-25 (Released:2014-05-20)
- 参考文献数
- 56
- 被引用文献数
- 11 14
To find tsunamis that affected the Pacific coast of eastern Japan during period between A.D. 869 and the 1600s, we searched a historical earthquake and tsunami database for tsunami descriptions. We examined reliability of the descriptions considering the written dates and independence of documents. As a result, at least two events were found. One is the Oei tsunami which occurred on September 1st, 1420 on the Julian calendar (the 7th month 23rd day, 27th year of Oei era on the Japanese calendar). The tsunami affected Kawarago and Aiga villages in Hitachi city, Ibaraki prefecture. Sea receded 9 times during 4 hours, exposing the coastal seafloor, and many fish were carried to the land. No description of earthquake ground shaking was found. The other is the Kyotoku earthquake tsunami which occurred on December 12th, 1454 (11th month 23rd day, 3rd year of Kyotoku era). An earthquake occurred in night and the tsunami widely inundated the coastal area of “Oshu” (the old name of province from Aomori to Fukushima prefectures). Many people were killed in the tsunami. Another entry in the database on December 31st, 1455 (11th month 23rd day, first year of Kosho era) is likely to be a fake event.
2 0 0 0 OA 山崎断層系大原断層のトレンチ調査
- 著者
- 遠田 晋次 宮腰 勝義 井上 大栄 楠 建一郎 鈴木 浩一
- 出版者
- 公益社団法人 日本地震学会
- 雑誌
- 地震 第2輯 (ISSN:00371114)
- 巻号頁・発行日
- vol.48, no.1, pp.57-70, 1995-05-25 (Released:2010-03-11)
- 参考文献数
- 15
- 被引用文献数
- 1 2
The Yamasaki fault system is located from the eastern Okayama to Hyogo Prefectures, southwest Japan, trending in NW-SE direction with a length of 87 kilometers. Earthquake risk evaluation of this fault system is not complete because the past seismic events have not been determined throughout the fault system. This paper reports a comprehensive survey of the Ohara fault, located at the northwestern end of the fault system. High resolution electrical exploration and five drillings at Ohara Town clearly identified the location of the fault underneath the sediment cover. Trench survey was then carried out to determine the past seismic events along the Ohara fault. The following conclusions were derived from these studies. (1) The Ohara fault shows up as a sharp resistivity contrast in the high resolution electrical exploration, reflecting mainly the difference in resistivity between acid tuff and black slate that constitute the northern and southern sides of the fault, respectively. (2) The trench observation in the log and radiocarbon dating of sediments revealed that the latest fault movement along the Ohara fault occurred between 150 and 1200 years B. P. The Harima Earthquake of 868 years AD is most likely to correspond to this fault movement. The timing of the event roughly coincides with the latest event of the Yasutomi fault (Okada et al., 1987) comprising the central part of the Yamasaki fault system. This strongly suggests that the Ohara and Yasutomi faults ruptured simultaneously or as a sequence of events during the Harima Earthquake. (3) The penultimate movement of the Ohara fault was estimated between 1500 and 3000 years B. P. If the latest event corresponds to the Harima Earthquake, then the interval between the last two events is estimated to be 400 to 1900 years. (4) The present trench survey revealed possibly four events along the Ohara fault during the Holocene. Thus the recurrence interval may be about 2500 years. Comparing this result with the interval between the last two events, movement of this fault system is likely to be aperiodic.
2 0 0 0 OA 電磁気学的手法による短期的地震前兆の観測的研究の現状
- 著者
- 長尾 年恭 鴨川 仁 服部 克巳
- 出版者
- 公益社団法人 日本地震学会
- 雑誌
- 地震 第2輯 (ISSN:00371114)
- 巻号頁・発行日
- vol.59, no.1, pp.69-85, 2006-08-31 (Released:2013-08-05)
- 参考文献数
- 80
- 被引用文献数
- 3 3
Despite its extreme importance and decades of efforts, practical short-term earthquake prediction still remains to be achieved in future. However, the electromagnetic research has been demonstrating some promises. This paper briefly reviews the recent progress of what we call “seismo-electromagnetics”, mainly referring to Japanese studies by the observational point of view. We demonstrate some results of observations, in varied frequency ranges, on the anomalous telluric current, ULF geomagnetic transient change, VLF-HF natural emissions and anomalous transmission of VLF and VHF band radio waves. We also summarize proposed physical mechanisms of these phenomena, including the notion called “Lithosphere-Atmosphere-Ionosphere (LAI) Coupling”. We believe that electromagnetic studies will play an important role in not only earthquake prediction but also in understanding physical processes of earthquake generation.
2 0 0 0 OA 地震のマグニチュード分布式のパラメータの推定
- 著者
- 宇津 徳治
- 出版者
- 公益社団法人 日本地震学会
- 雑誌
- 地震 第2輯 (ISSN:00371114)
- 巻号頁・発行日
- vol.31, no.4, pp.367-382, 1978-12-25 (Released:2010-03-11)
- 参考文献数
- 7
- 被引用文献数
- 5 18
In many cases, the log-frequency vs magnitude curves for earthquakes show considerable curvature, though the well-known G-R (Gutenberg-Richter) formula predicts a straight line. To represent such data, two modifications of the G-R formula have been proposed.log n(M)=a-bM M≤cn(M)=0 M>c} (2)and log n(M)=a-bM+log(c-M) M<cn(M)=0 M≥c} (3)These are called here the truncated G-R formula and the modified G-R formula, respectively. These equations can be written in the form of probability density function:f(x)=B/1-e-BCe-Bx C≥x≥0 (5)f(x)=B2/e-BC+BC-1e-Bx(C-x) C>x≥0 (6)where x=M-MS, B=b ln 10, C=c-MS, and MS is the lower limit of magnitude above which the data is complete.The estimation of B and C in equation (5) by the method of moments was discussed by Okada (1970) and Cosentino et al. (1977). The equations proposed here areexpC(C-2x)/Cx-x2=C2-2Cx-x2/2x2-x2 (16)B=(2x-C)/(x2-Cx) (15)or x2/x2=2-BC(BC+2)/(eBC-1)/1-BC/(eBC-1) (18)Bx=1-BC/(eBC-1) (19)The maximum likelihood method for equation (5) yields only one equation (equation (19), Page (1968), Okada (1970)). If we adopt C=Max(xi) as the second equation, the C value is considerably biased. To correct the bias, a correction ΔC which is a function of B and C is proposed. For this correction we must use some estimated values for B and C.To estimate B and C in equation (6) by the method of moments the following equations are used.x2/x2(e-BC+BC-1){e-BC(B2C2+4BC+6)+2BC-6}/{e-BC(BC+2)+BC-2}2 (25)Bx=e-BC(BC+2)+BC-2/e-BC+BC-1 (23)The maximum likelihood estimates of B and C in equation (6) can be obtained by the equation:2-Bx=C/S ∑Si=1 1/C-xi=BC(1-e-BC)/e-BC+BC-1 (27), (29)The accuracy of B and C values determined by the above methods is estimated by Monte Carlo technique for the cases of S=50, 100, 200, 400, and 800 and several values of B and C. If we adopt the truncated G-R formula, the second method (which uses C=Max(xi)+ΔC) gives more accurate C values, whereas the accuracy of B values is almost the same as that obtained by the method of moments. If we adopt the modified G-R formula, the maximum likelihood method gives more accurate B and C values than the method of moments. The η value (η=x2/x2) is a useful index for the deviation of the distribution of data from the G-R formula (for the G-R formula, theoretical value for η is 2). An application of the present methods shows regional variations in b, c, and η values of shallow earthquakes in Japan.
2 0 0 0 OA 1983年日本海中部地震の前震と余震の震源分布
- 著者
- 海野 徳仁 長谷川 昭 小原 一成 松沢 暢 清水 洋 高木 章雄 田中 和夫 小菅 正裕
- 出版者
- 公益社団法人 日本地震学会
- 雑誌
- 地震 第2輯 (ISSN:00371114)
- 巻号頁・発行日
- vol.38, no.3, pp.399-410, 1985-09-25 (Released:2010-03-11)
- 参考文献数
- 13
- 被引用文献数
- 1 6
Hypocenter determination for aftershocks of the 1983 Japan Sea Earthquake (M7.7) is made by using the seismic networks of Tohoku University and of Hirosaki University. The obtained aftershock area is 160km long in north-south direction with a width of 40km, distributing itself along the eastern margin of the Japan Basin. Most of the aftershocks are located within the area bordered by the 2000m and 3000m isobaths, northern and southern ends being surrounded by the Sado Ridge and the Oshima Plateau, respectively. Precise hypocenter distribution deliniates an eastward dipping fault plane with a shallow dip angle. Almost all the aftershocks are located in the crust, which is consistent with the fact that the PMP phase is clearly observed from most of the aftershocks.A remarkable later phase is observed at many stations 4-7 sec after the P arrival. This later phase is interpreted as the reflected wave both at the sea surface and at the Moho discontinuity (pwPMP). Focal depth distribution estimated from arrival time differences between PMP and pwPMP phases also shows the eastward dipping fault plane with a shallow dip angle.Foreshock activity started 12 days before the occurrence of the main shock within a concentrated area in the vicinity of the main shock hypocenter. All the foreshocks are classified into two groups: one with high peak-frequency and the other with low peak-frequency, each having very similar wave forms. Hypocenters of low peak-frequency events are located at shallower depths than those of the main shock and high peak-frequency events.
2 0 0 0 OA えびの地震に関する2, 3の考察
- 著者
- 渡辺 邦彦
- 出版者
- 公益社団法人 日本地震学会
- 雑誌
- 地震 第2輯 (ISSN:00371114)
- 巻号頁・発行日
- vol.23, no.1, pp.32-40, 1970-04-28 (Released:2010-03-11)
- 参考文献数
- 6
On February 21, 1968, a large earthquake occurred at Ebino plateau, south-west part of Miyazaki Pref. in Kyushu. Since then, Ebino earthquake swarm had been active for about one year. Abuyama Seis. Obs., Sakurajima Volcano. Obs. and Disast. Prey. Res. Inst. of Kyoto Univ. made the temporary observation at 5 stations. The main results on the nature of the Ebino earthquake swarm are as follows:1) The epicentral region characteristically changed its shape with time.2) The aspects of the push-pull distribution of the initial P motions appeared to be nearly the same both in large shocks and microearthquakes, showing the same focal mechanism in both cases. This phenomenon does not seem to vary throughout the whole period of this study.3) According to the wave-period analysis, we recognized the interesting relation between the location of the epicenter and the _frequency of those shocks. It may be considered that this was caused by the difference of the properties of the crustal rocks in the hypocentral region from those outside the focal area.
2 0 0 0 OA 地震に先駆するP波速度変化地域の検出
- 著者
- 宇津 徳治
- 出版者
- 公益社団法人 日本地震学会
- 雑誌
- 地震 第2輯 (ISSN:00371114)
- 巻号頁・発行日
- vol.28, no.4, pp.435-448, 1975-12-10 (Released:2010-03-11)
- 参考文献数
- 9
- 被引用文献数
- 1 2
About 400 shallow earthquakes in central Japan occurring during 1967-1974 have been relocated using data supplied by the Japan Meteorological Agency and several university seismic stations. About 4200 P-residuals are obtained in the relocation. The residual is approximately normally distributed with a mean of 0.0sec and a standard deviation of 0.59sec. Therefore, the probability that a residual exceeds 0.4sec is 0.25. If the actual travel-time for paths crossing the focal region of an impending earthquake is increased by 0.4sec, the probability that an observed residual for one of these paths exceeds 0.4sec will be 0.50. Let R denotes the ratio of the number of paths with residuals larger than 0.4sec to the total number of the paths crossing a certain region. The R-values for the focal regions of the central Gifu earthquake of 1969 (M=6.6), the Izu-hanto-oki earthquake of 1974 (M=6.9), and other 24 earthquakes of smaller magnitudes during some time-intervals before the occurrence of them have been determined to be about 0.5 or more. These values suggest the decrease in P-velocity before the earthquakes. A map has been made showing the distribution of R-values in 204 areas of 0.2°×0.2° in central Japan. Significantly high R-values are found in the areas containing the focal regions of the above-mentioned two earthquakes in the maps covering certain periods before the earthquakes. However, there are many other areas of high R-values, which are not connected with the occurrence of large earthquakes until now. Most of these areas may correspond to inherent low-velocity regions in the crust.
2 0 0 0 OA 西南日本に沈み込むフィリピン海プレートの形状と三次元応力分布 (第2報)
- 著者
- 橋本 学
- 出版者
- 公益社団法人 日本地震学会
- 雑誌
- 地震 第2輯 (ISSN:00371114)
- 巻号頁・発行日
- vol.34, no.2, pp.197-211, 1981-08-25 (Released:2010-03-11)
- 参考文献数
- 18
- 被引用文献数
- 1 1
A three-dimensional finite element method is used to simulate the observed stress state in the Southwestern Japan, which has been inferred by SHIONO (1977). Two different types of model are presented here, one is a locked model and the other is a decoupled model, where the former preserves a tight contact between the subducting Philippine Sea plate and the overriding continental plate, while the latter has a weak zone between them. In these models three different types of force are applied;(1) a negative buoyancy due to the density contrast between the subducting plate and surrounding mantle, (2) a northwestward compressional force generated by the movement of the Philippine Sea plate, (3) a westward compressional force due to the subducting Pacific plate.It is found that the observed extensional stress parallel to the leading edge of the subducting Philippine Sea plate may be caused mainly by a negative buoyancy, suggesting that the plate seems to sink down into the mantle by its own weight. The observed E-W compressional stress field prevailing in the Inner zone appears to be closely associated with the subduction of the Pacific plate. The northwestward horizontal compressional force may be smaller than the westward compressional force, and seems to be less than 500bars. The present calculations suggest that a low velocity layer between the oceanic and continental plates gives appreciable effects on low-angled thrust faulting off the Kii peninsula and the Shikoku island.
2 0 0 0 GRACE地震学
- 著者
- 田中 優作 日置 幸介
- 出版者
- 公益社団法人 日本地震学会
- 雑誌
- 地震 第2輯 (ISSN:00371114)
- 巻号頁・発行日
- vol.69, pp.69-85, 2017 (Released:2017-05-26)
- 参考文献数
- 71
The Gravity Recovery and Climate Experiment (GRACE) satellite system was launched in 2002, and has been playing important roles in various disciplines of earth and environmental sciences through measuring time-variable gravity field of the earth. It also offers a unique viewpoint to study earthquakes in terms of mass redistribution. We provide a review of earthquake studies with GRACE, e.g. basic facts of the satellite system and available data types, several kinds of non-earthquake gravity changes which may mask the earthquake-related signals. We also summarize past researches about co- and postseismic gravity changes. Two dimensional coseismic gravity changes were first observed with GRACE for the 2004 Sumatra-Andaman earthquake. After that, GRACE has caught coseismic gravity changes of the 2010 Maule, the 2011 Tohoku-oki, the 2012 Indian-ocean, and the 2013 Okhotsk deep-focus earthquakes. Such coseismic gravity changes are due mainly to two factors, i.e., the density changes around the fault edges, and the vertical deformations of boundaries with density contrasts such as the surface and the Moho. Short- and long-term postseismic gravity changes are considered to stem from afterslip and viscoelastic relaxation, respectively, but further studies are needed to quantitatively explain the observations.
2 0 0 0 OA 1900年宮城県北部地震のマグニチュードと震源位置の再評価
- 著者
- 武村 雅之
- 出版者
- 公益社団法人 日本地震学会
- 雑誌
- 地震 第2輯 (ISSN:00371114)
- 巻号頁・発行日
- vol.58, no.1, pp.41-53, 2005-06-10 (Released:2010-03-11)
- 参考文献数
- 32
- 被引用文献数
- 1 4
Three damaging inland earthquakes have occurred in the northern Miyagi Prefecture of the Tohoku District in Japan since 1900. Magnitudes M of the 1962 and the 2003 events were assigned to be 6.5 and 6.4, respectively, from local seismic records observed by the Japan Meteorological Agency (JMA). That of the 1900 event was 7.0, which was determined mainly from the seismic intensity data, while the rank of damage was very lower than other M=7 class inland shallow earthquakes in Japan. In the present study, damage rate data, seismic intensity data, and old seismograms were re-examined to evaluate the magnitude and the location of the focal region of the 1900 event. Re-evaluated magnitude of this event is almost the same as those of the 1962 and 2003 events. The seismic gap between the 1962 and 2003 events is filled with the focal region of the 1900 event obtained. The possibility of a big shallow earthquake occurrence must be very low in near future in the seismic zone of the northern Miyagi Prefecture.
2 0 0 0 OA 地球浅部の温度構造
- 著者
- 田中 明子
- 出版者
- 公益社団法人 日本地震学会
- 雑誌
- 地震 第2輯 (ISSN:00371114)
- 巻号頁・発行日
- vol.61, no.Supplement, pp.239-245, 2009-07-31 (Released:2013-11-21)
- 参考文献数
- 47
- 被引用文献数
- 1 3
This paper addresses some issues related to relationship between lithospheric thermal regime and depth extent of seismicity. Thickness of seismogenic crustal layer correlates with surface heat flow in most intraplate seismic areas of the world. Although inverse relationship between heat flow and the base of seismogenic zone is obvious, quantitative relationships are less certain. Compilation of previous studies shows that temperatures at the base of seismogenic zone appear to be distributed from about 250° to 450° over a large depth interval, 5-30 km, at different tectonic settings. It supports that temperature is one of factors governing the focal depth. Variations in lithology, slip rate, pore pressure, and focal mechanism may account for the temperature difference. Geothermal gradient data and bottom depth of magnetized layers are also useful proxy to reveal the base of seismogenic zone. These multidisciplinary data may provide a useful indicator of lithospheric thermal structure and improve the correlation with depth limit of seismicity.
2 0 0 0 744年天平肥後地震と869年貞観肥後風水災について
- 著者
- 石橋 克彦 原田 智也
- 出版者
- 公益社団法人 日本地震学会
- 雑誌
- 地震 第2輯 (ISSN:00371114)
- 巻号頁・発行日
- vol.70, pp.13-20, 2017-05-10 (Released:2017-09-07)
- 参考文献数
- 38
- 被引用文献数
- 2
2 0 0 0 OA 2011年東北地方太平洋沖地震後の東北地方北部での誘発地震活動
- 著者
- 小菅 正裕 渡邉 和俊 橋本 一勲 葛西 宏生
- 出版者
- 公益社団法人 日本地震学会
- 雑誌
- 地震 第2輯 (ISSN:00371114)
- 巻号頁・発行日
- vol.65, no.1, pp.69-83, 2012-09-28 (Released:2012-10-26)
- 参考文献数
- 33
- 被引用文献数
- 1 5
We have investigated the inland seismic activity induced by the 2011 Off the Pacific coast of Tohoku (Tohoku-oki) Earthquake in the northern part of Tohoku district, using JMA catalog and newly determined focal mechanism solutions. The seismicity is quite high in the Akita prefecture, forming newly activated clusters. The cluster locations are complementary for the periods before and after the Tohoku-oki Earthquake. A stress tensor inversion using focal mechanism data indicates that the stress field has changed from reverse-faulting regime to strike-slip regime, with a counter-clockwise rotation of the maximum principal stress axis and the replacement of the other two principal axes. This change is qualitatively explained by the weakened E-W compressional stress due to megathrust faulting of the Tohoku-oki Earthquake. Thus the new stress field in the investigated area is unfavorable to the preexisting fault planes of reverse faulting, which brought the complementary seismic activity. Among the three active clusters in the Akita prefecture, the one to the north of Moriyoshi volcano is interesting, because the swarm-like activity forms a volumetric source with a dimension of about 3 km. Considering a possible existence of crustal fluid suggested by a reflected phase, delayed beginning of seismic activity about 2 month from the Tohoku-oki Earthquake, and the migration of seismic activity, the induced seismic activity in the area may be related to a response of crustal fluid to the coseismic stress change. Detailed investigation of the result of stress tensor inversion reveals the existence of local stress field superposed on the regional field represented by the average stress tensor. Inferred local stress field exists in the Tsugaru Strait area, southern part of Akita prefecture, and Kitakami Mountains.
2 0 0 0 OA 長野県西部地域における二重スペクトル比によるS波減衰の推定
- 著者
- 松澤 孝紀 武尾 実 井出 哲 飯尾 能久 伊藤 久男 今西 和俊 堀内 茂木
- 出版者
- 公益社団法人 日本地震学会
- 雑誌
- 地震 第2輯 (ISSN:00371114)
- 巻号頁・発行日
- vol.56, no.1, pp.75-88, 2003-06-02 (Released:2010-03-11)
- 参考文献数
- 21
- 被引用文献数
- 3
We estimated S-wave attenuation (QS-1) in a wide frequency range between 4Hz and 60Hz using the twofold spectral ratio [Matsuzawa et al. (1989)] in the western Nagano region, Japan, where the 1984 Naganoken-Seibu earthquake (M6.8) occurred and the seismicity is still active. In the region, there are 49 seismic stations in a range of around 10km in diameter and station separation is several kilometers. In this analysis, 156 shallow (depth <10km) events (0.9≤MW≤2.6) are used. We can effectively reduce the errors of the estimation by using a number of ray paths. We also determined the focal mechanisms of these events and corrected the waveform amplitudes using them. The direct S-wave portions of the seismograms are relatively small in a high frequency range (above 60Hz) at surface stations compared to the lower frequency waves, and contaminated by P-coda waves. Thus, to estimate QS-1 value, we used only the waves whose S/N ratios are greater than 2, where the noise levels are calculated for the time windows just before S-wave arrivals. Obtained QS-1 values show strong frequency dependence below 10Hz, but weak above 10Hz. These values are slightly larger than the ones estimated by Yoshimoto et al. (1998) from the coda-normalization method. This difference is probably owing to the fracture area of the 1984 Naganoken-Seibu earthquake that has strong attenuation.
2 0 0 0 OA 阿寺断層の最新活動時期
2 0 0 0 小繰り返し地震解析による宮城・福島県沖プレート境界の準静的すべり
- 著者
- 内田 直希 松澤 暢 三浦 哲 平原 聡 長谷川 昭
- 出版者
- SEISMOLOGICAL SOCIETY OF JAPAN
- 雑誌
- 地震. 2輯 (ISSN:00371114)
- 巻号頁・発行日
- vol.59, no.4, pp.287-295, 2007-03-25
- 参考文献数
- 26
- 被引用文献数
- 5 4
Spatio-temporal distribution of quasi-static slip on the plate boundary east off Miyagi and Fukushima prefectures, NE Honshu, Japan is estimated by using small repeating earthquake data. The analysis of small repeating earthquakes has advantages of relatively high spatial resolution, especially near the trench, and the availability of long-term data (22 years) compared to GPS data. The results show that the repeating earthquakes are distributed outside the coseismic slip areas (asperities) of large earthquakes, showing that fault creep is dominant outside the asperities. The cumulative slip (slip histories) of small repeating earthquake groups reveal the existence of many non-steady aseismic slip events. Most of the episodic quasi-static slip events are associated with <I>M</I>≥ 6 earthquakes and they are frequently seen in the areas near the Japan trench in particular. Minor afterslip (∼15cm) of the 2005 Miyagi-oki earthquake (<I>M</I>7.2) is also estimated in the area which encompasses the coseismic slip area of the 2005 earthquake.
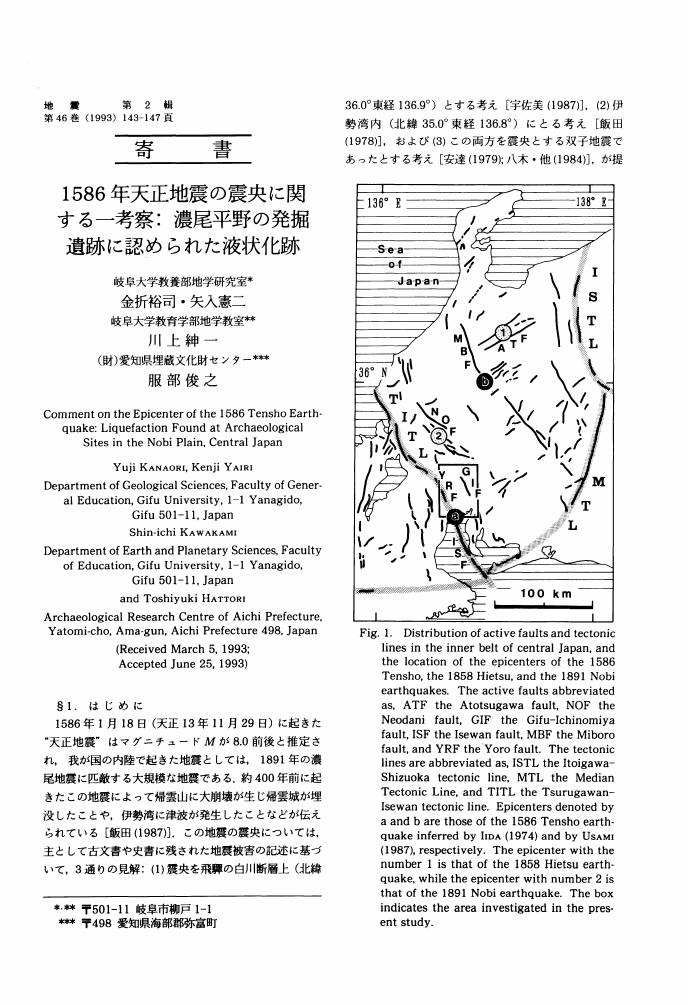
2 0 0 0 OA 1586年天正地震の震央に関する一考察
- 著者
- 金折 裕司 矢入 憲二 川上 紳一 服部 俊之
- 出版者
- 公益社団法人 日本地震学会
- 雑誌
- 地震 第2輯 (ISSN:00371114)
- 巻号頁・発行日
- vol.46, no.2, pp.143-147, 1993-09-24 (Released:2010-03-11)
- 参考文献数
- 27
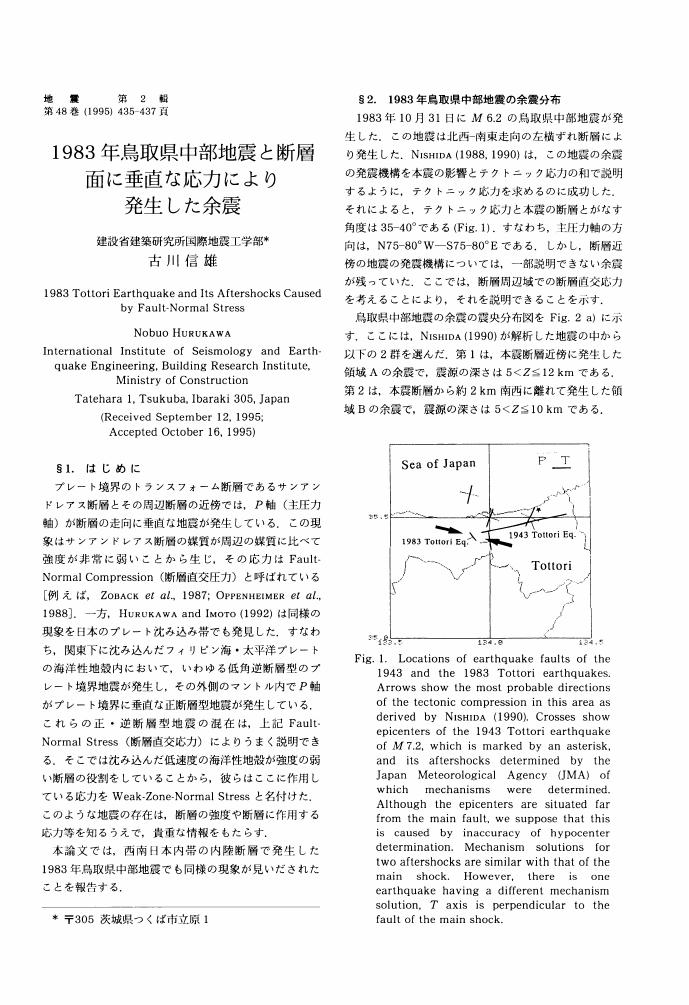
2 0 0 0 OA 1983年鳥取県中部地震と断層面に垂直な応力により発生した余震
- 著者
- 古川 信雄
- 出版者
- 公益社団法人 日本地震学会
- 雑誌
- 地震 第2輯 (ISSN:00371114)
- 巻号頁・発行日
- vol.48, no.3, pp.435-437, 1995-11-25 (Released:2010-03-11)
- 参考文献数
- 7
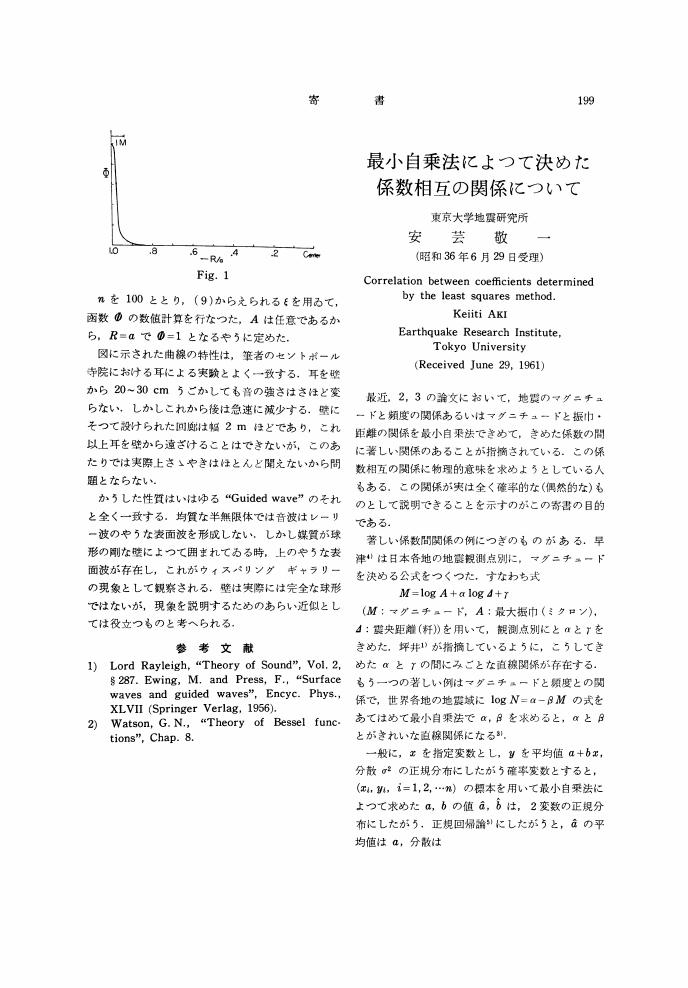
2 0 0 0 OA 最小自乗法によつて決めた係数相互の関係について
- 著者
- 安芸 敬一
- 出版者
- 公益社団法人 日本地震学会
- 雑誌
- 地震 第2輯 (ISSN:00371114)
- 巻号頁・発行日
- vol.14, no.3, pp.199-201, 1961-09-25 (Released:2010-03-09)
- 参考文献数
- 6
- 著者
- 水野 真理子 佐藤 利典 篠原 雅尚 望月 公廣 山田 知朗 金澤 敏彦
- 出版者
- SEISMOLOGICAL SOCIETY OF JAPAN
- 雑誌
- 地震 第1輯 (ISSN:00371114)
- 巻号頁・発行日
- vol.62, no.1, pp.19-23, 2009
- 被引用文献数
- 2


